

For countless people, across all spectrums and walks of life, learning to drive is a pivotal moment in their lives. By getting your licence and first car, the symbols of true freedom and independence, you can go wherever you want – so long as there is a road to get you there.
However, driving daily as an experience can vary from location to location – with different accident rates, levels of congestion and even driving test pass rates. So, where are the best places to get your licence and drive a car in the UK? We’ve got you covered with a large amount of data acquired through the DVSA.
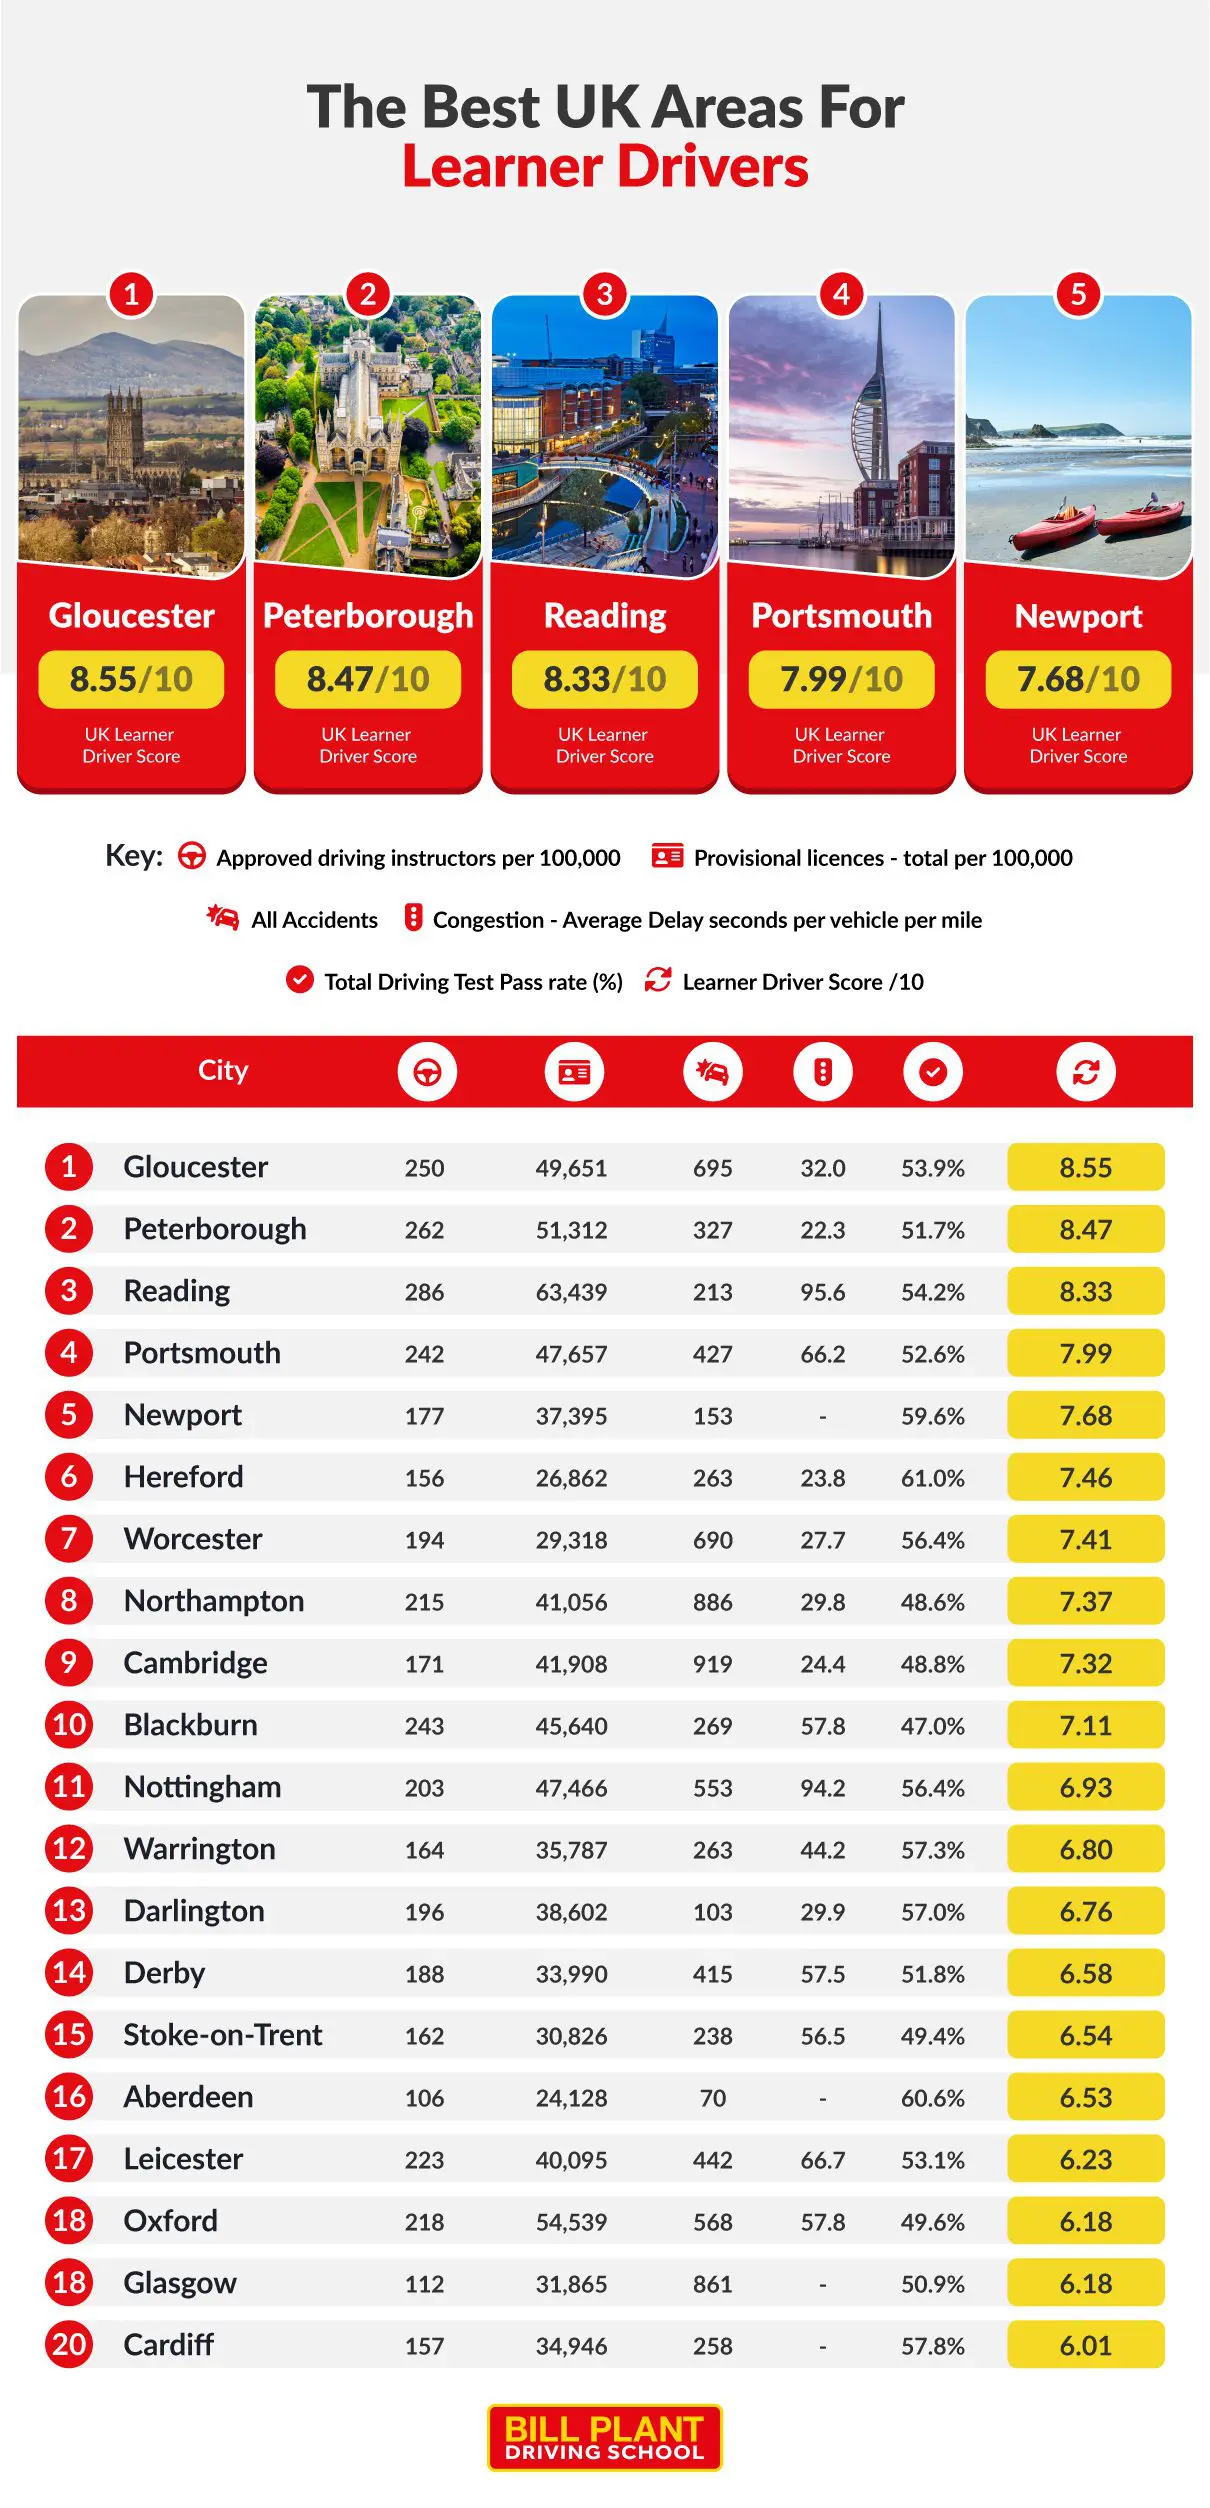
The best UK areas for learner drivers
For this section, we scored each location on the following factors: The number of DVSA Approved Driving instructors, the number of people with provisional licences, the number of road accidents, and driving test pass rates. Congestion was omitted from our overall ranking due to a lack of data for Scottish and Welsh cities, along with London.
Comparing each location, we gave a score out of 10 for each factor. Using these scores, we then took an average to give an overall UK Learner Driver Score out of 10.
1 – Gloucester
UK Learner Driver Score: 8.55/10
Claiming the number one spot for learner drivers we have Gloucester, near the rural area of the Cotswold, plus the tomb of King Edward II is located here. Having ranked well on both driving instructor availability and the number of provisional licence holders within the city, and placing within the top fifteen for the least number of road accidents, Gloucester is to be considered a safe and convenient place to learn to drive.
2 – Peterborough
UK Learner Driver Score: 8.47/10
Overall, Peterborough comes in second among the best cities for learner drivers in the UK. With 166 total accidents over the 2021-22 period, it is one of the safer locations in this ranking and with 262 DVSA driving instructors per 100,000 of the city’s population, there’s plenty of choice for tutelage, plus Peterborough has higher than average pass rates at 51.7%.
3 – Reading
UK Learner Driver Score: 8.33/10
Rounding out the top three we have Reading, in southern England, best known for its annual Reading Festival which is an outdoor event featuring rock music. Ranking high for the most DVSA-approved driving instructors and provisional licence holders, it was the city’s higher accident rate that held it back.
4 – Portsmouth
UK Learner Driver Score: 7.99/10
Portsmouth, the port and naval base city in southern England has made it into the overall top five. With 242 DVSA driving instructors per 100,000 of the city’s population and a 52.6% pass rate, Portsmouth gives you a better than 50/50 chance to get your licence the first time around.
5 – Newport
UK Learner Driver Score: 7.68
With a high pass rate of 59.6%, which is the highest in the top five, Newport takes the fifth spot. The higher pass rate and your pick of driving instructors from the 177 per 100,000 people should indicate that passing your driving test in this city should be comparatively easier to do the first time, saving you money from repeatedly taking the test.
1 – Reading
Approved Driving Instructors per 100,000: 286
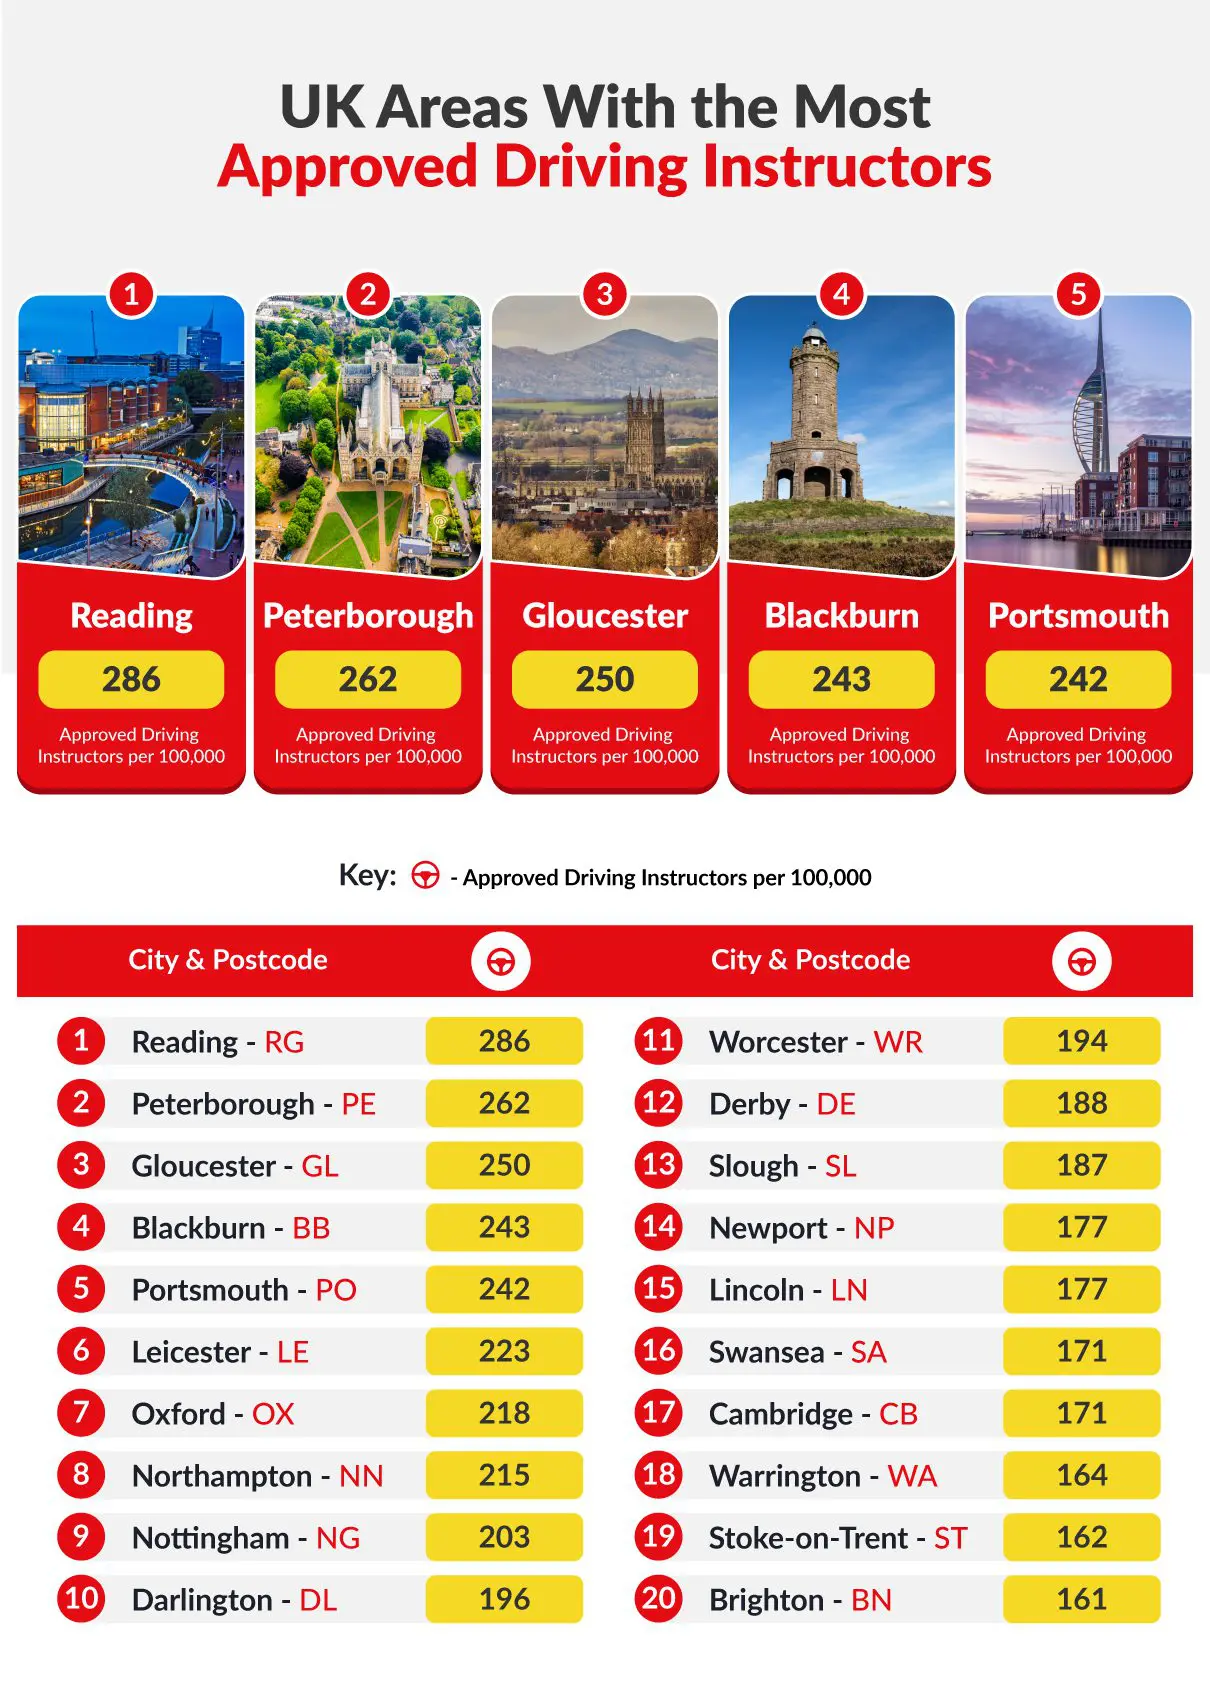
First up, we have Reading as our city with the most approved driving instructors in the UK, this city gives you plenty of choices to find the right instructor for you so that you can pass your driving test first try.
2 – Peterborough
Approved Driving Instructors per 100,000: 262
Peterborough, despite having a population of over 200,000, has 262 DVSA-approved driving instructors per 100,000 people in the city, according to government data as of December 2021.
3 – Gloucester
Approved Driving Instructors per 100,000: 250
With one of the smaller populations in this ranking, Gloucester takes the third spot. Despite its smaller population, there are still plenty of approved driving instructors to choose from and this should help to ensure you get an instructor best suited to you.
4 – Blackburn
Approved Driving Instructors per 100,000: 243
The industrial town of Blackburn is next, in the county of Lancashire, with a population of 150,030 as per ONS data from 2020, bigger than that of the previous city, Gloucester. Despite this, Blackburn still has a good amount of highly trained driving instructors for you to choose from.
5 – Portsmouth
Approved Driving Instructors per 100,000: 242
The fifth place brings us to Portsmouth, the city with the highest population in the top five for most driving instructors. Their 520 DVSA-approved driving instructors become 242 per 100,000 of the city’s population, making it almost half, yet still a vast array to choose from.
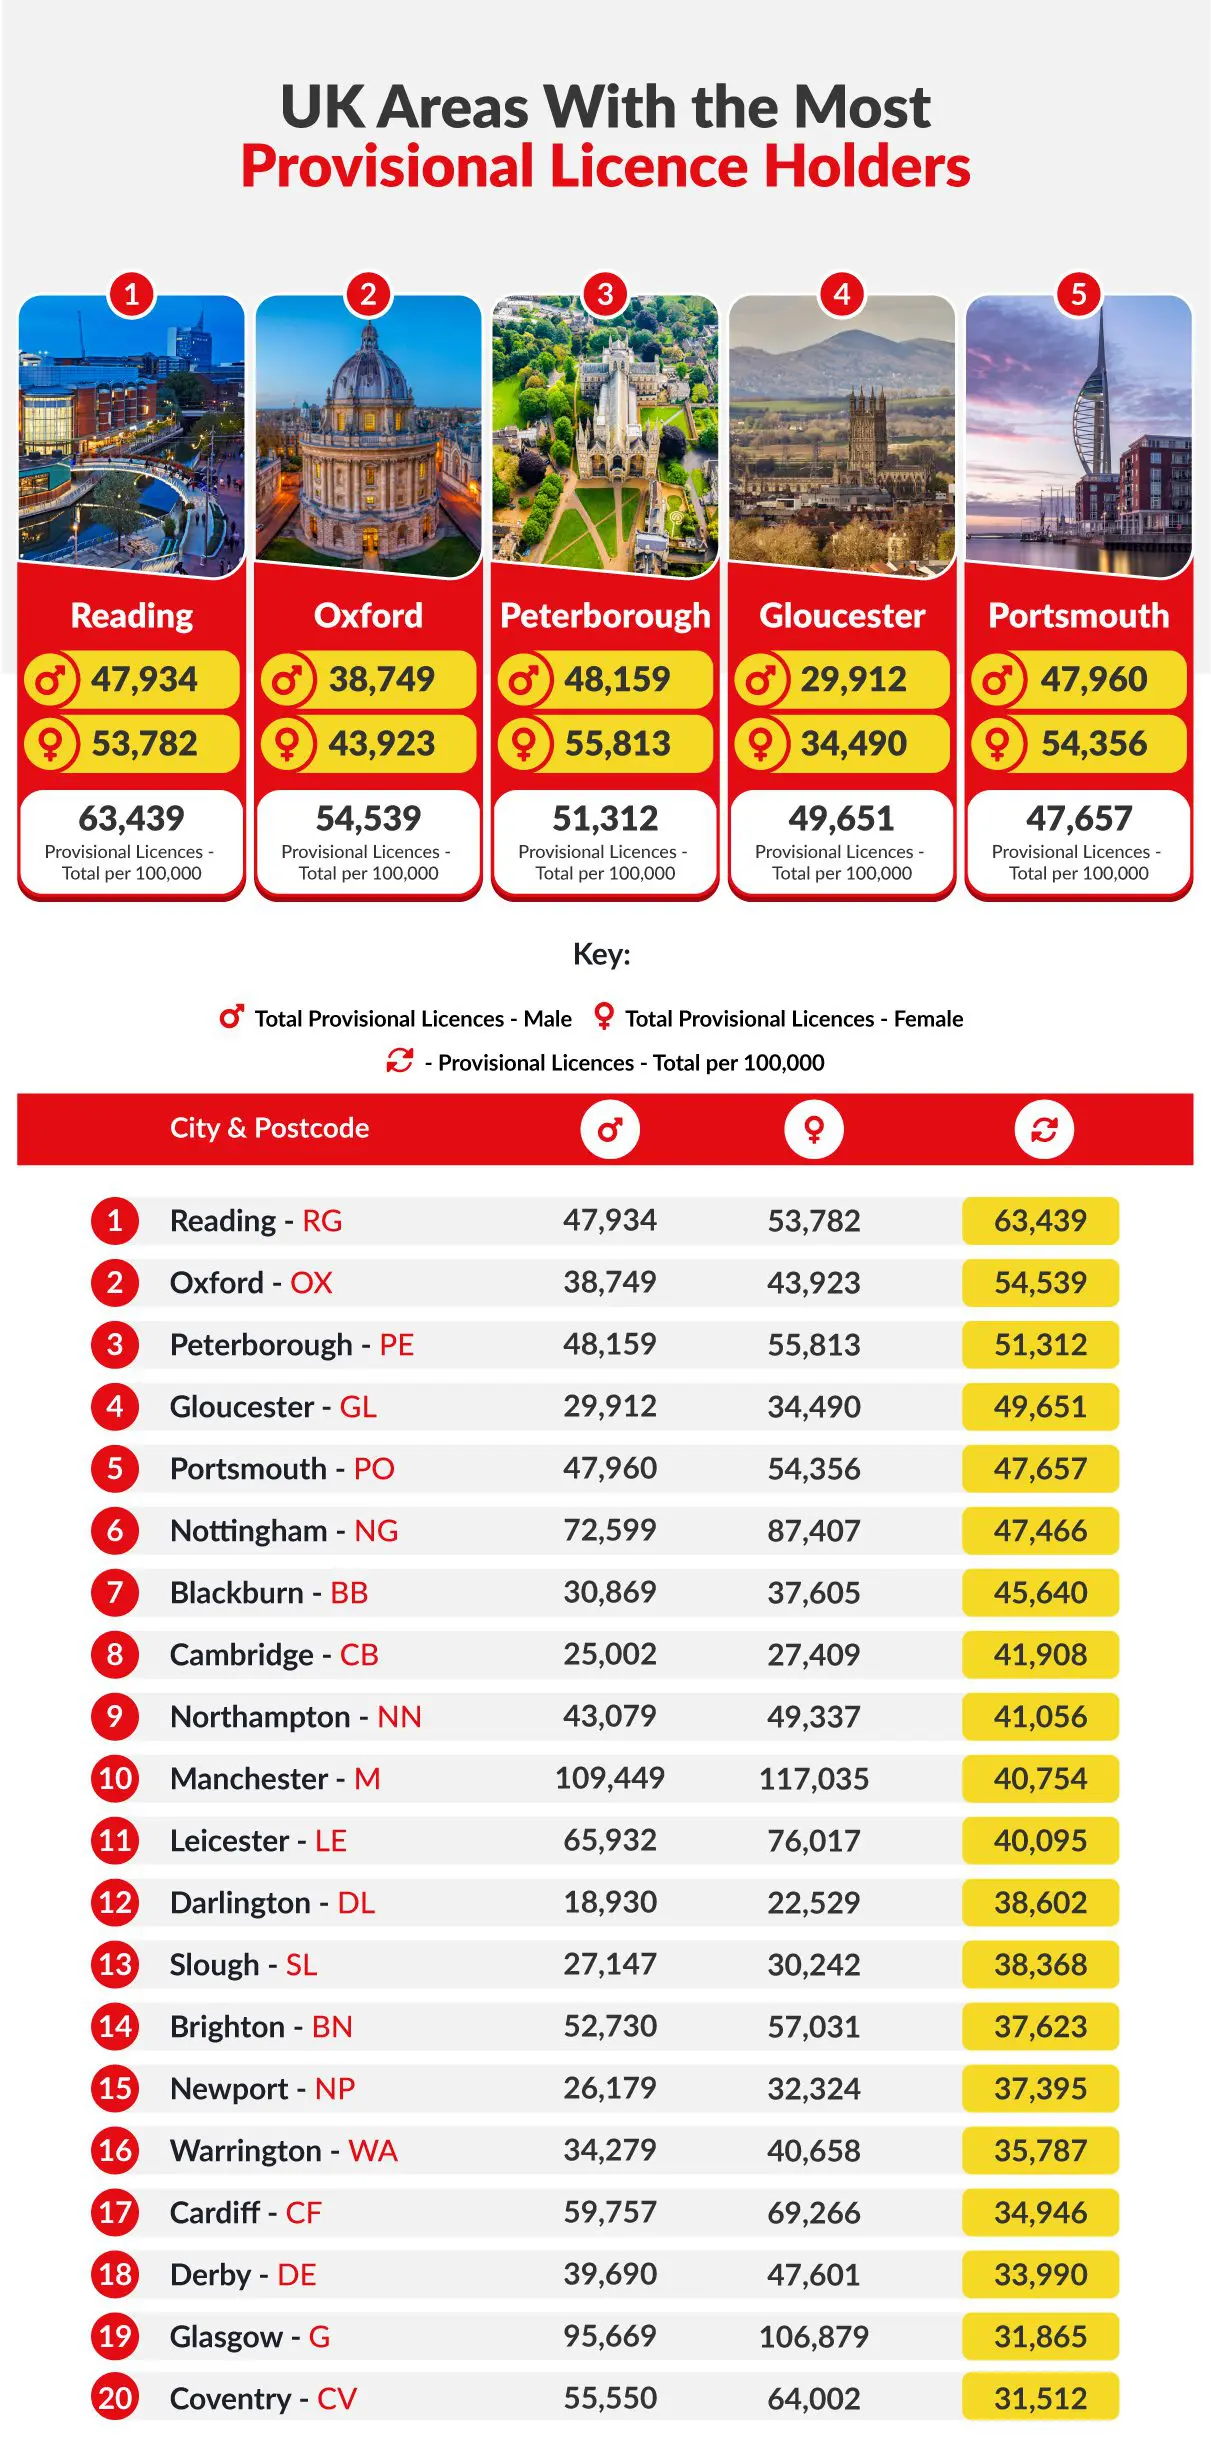
1 – Reading
Male Provisional Licence Holders: 47,934 | Female Provisional Licence Holders: 53,782 | Total Provisional Licence Holders per 100,000: 63,439
Reading takes the top spot here too, with 63,439 provisional licence holders per 100,000 people. The city recorded a 54.2% pass rate from April 2021 to March 2022, so surely you won’t be holding on to yours for as long as you earn your full licence.
2 – Oxford
Male Provisional Licence Holders: 38,749 | Female Provisional Licence Holders: 43,923 | Total Provisional Licence Holders per 100,000: 54,539
Another city home to a highly prestigious university, Oxford comes in second place for the city with the most provisional licence holders and like Reading, it’s located in the south of England.
3 – Peterborough
Male Provisional Licence Holders: 48,159 | Female Provisional Licence Holders: 55,813 | Total Provisional Licence Holders per 100,000: 51,312
Peterborough too has plenty of learner drivers, with 51,312 provisional licence holders per 100,000 people, making it one of the biggest learner driver cities in the whole of the UK. Having also ranked well for the number of driving instructors, Peterborough is a great place for learner drivers.
4 – Gloucester
Male Provisional Licence Holders: 29,912 | Female Provisional Licence Holders: 34,490 | Total Provisional Licence Holders per 100,000: 49,651
Coming in fourth, we have Gloucester which is again in Southern England, the city population stands at 129,709 as per ONS data and they have 64,402 provisional licence holders in total, meaning that nearly 50% of the city has a provisional licence.
5 – Portsmouth
Male Provisional Licence Holders: 47,960 | Female Provisional Licence Holders: 54,356 | Total Provisional Licence Holders per 100,000: 47,657
Portsmouth takes the fifth spot, with 47,657 provisional licence holders per 100,000 making it one of the biggest learner driver cities in the UK. The city has a pass rate of 52.6%, so choosing from the city’s vast array of driving instructors, it is imperative you make the right choice to boost your chances of earning your full licence.
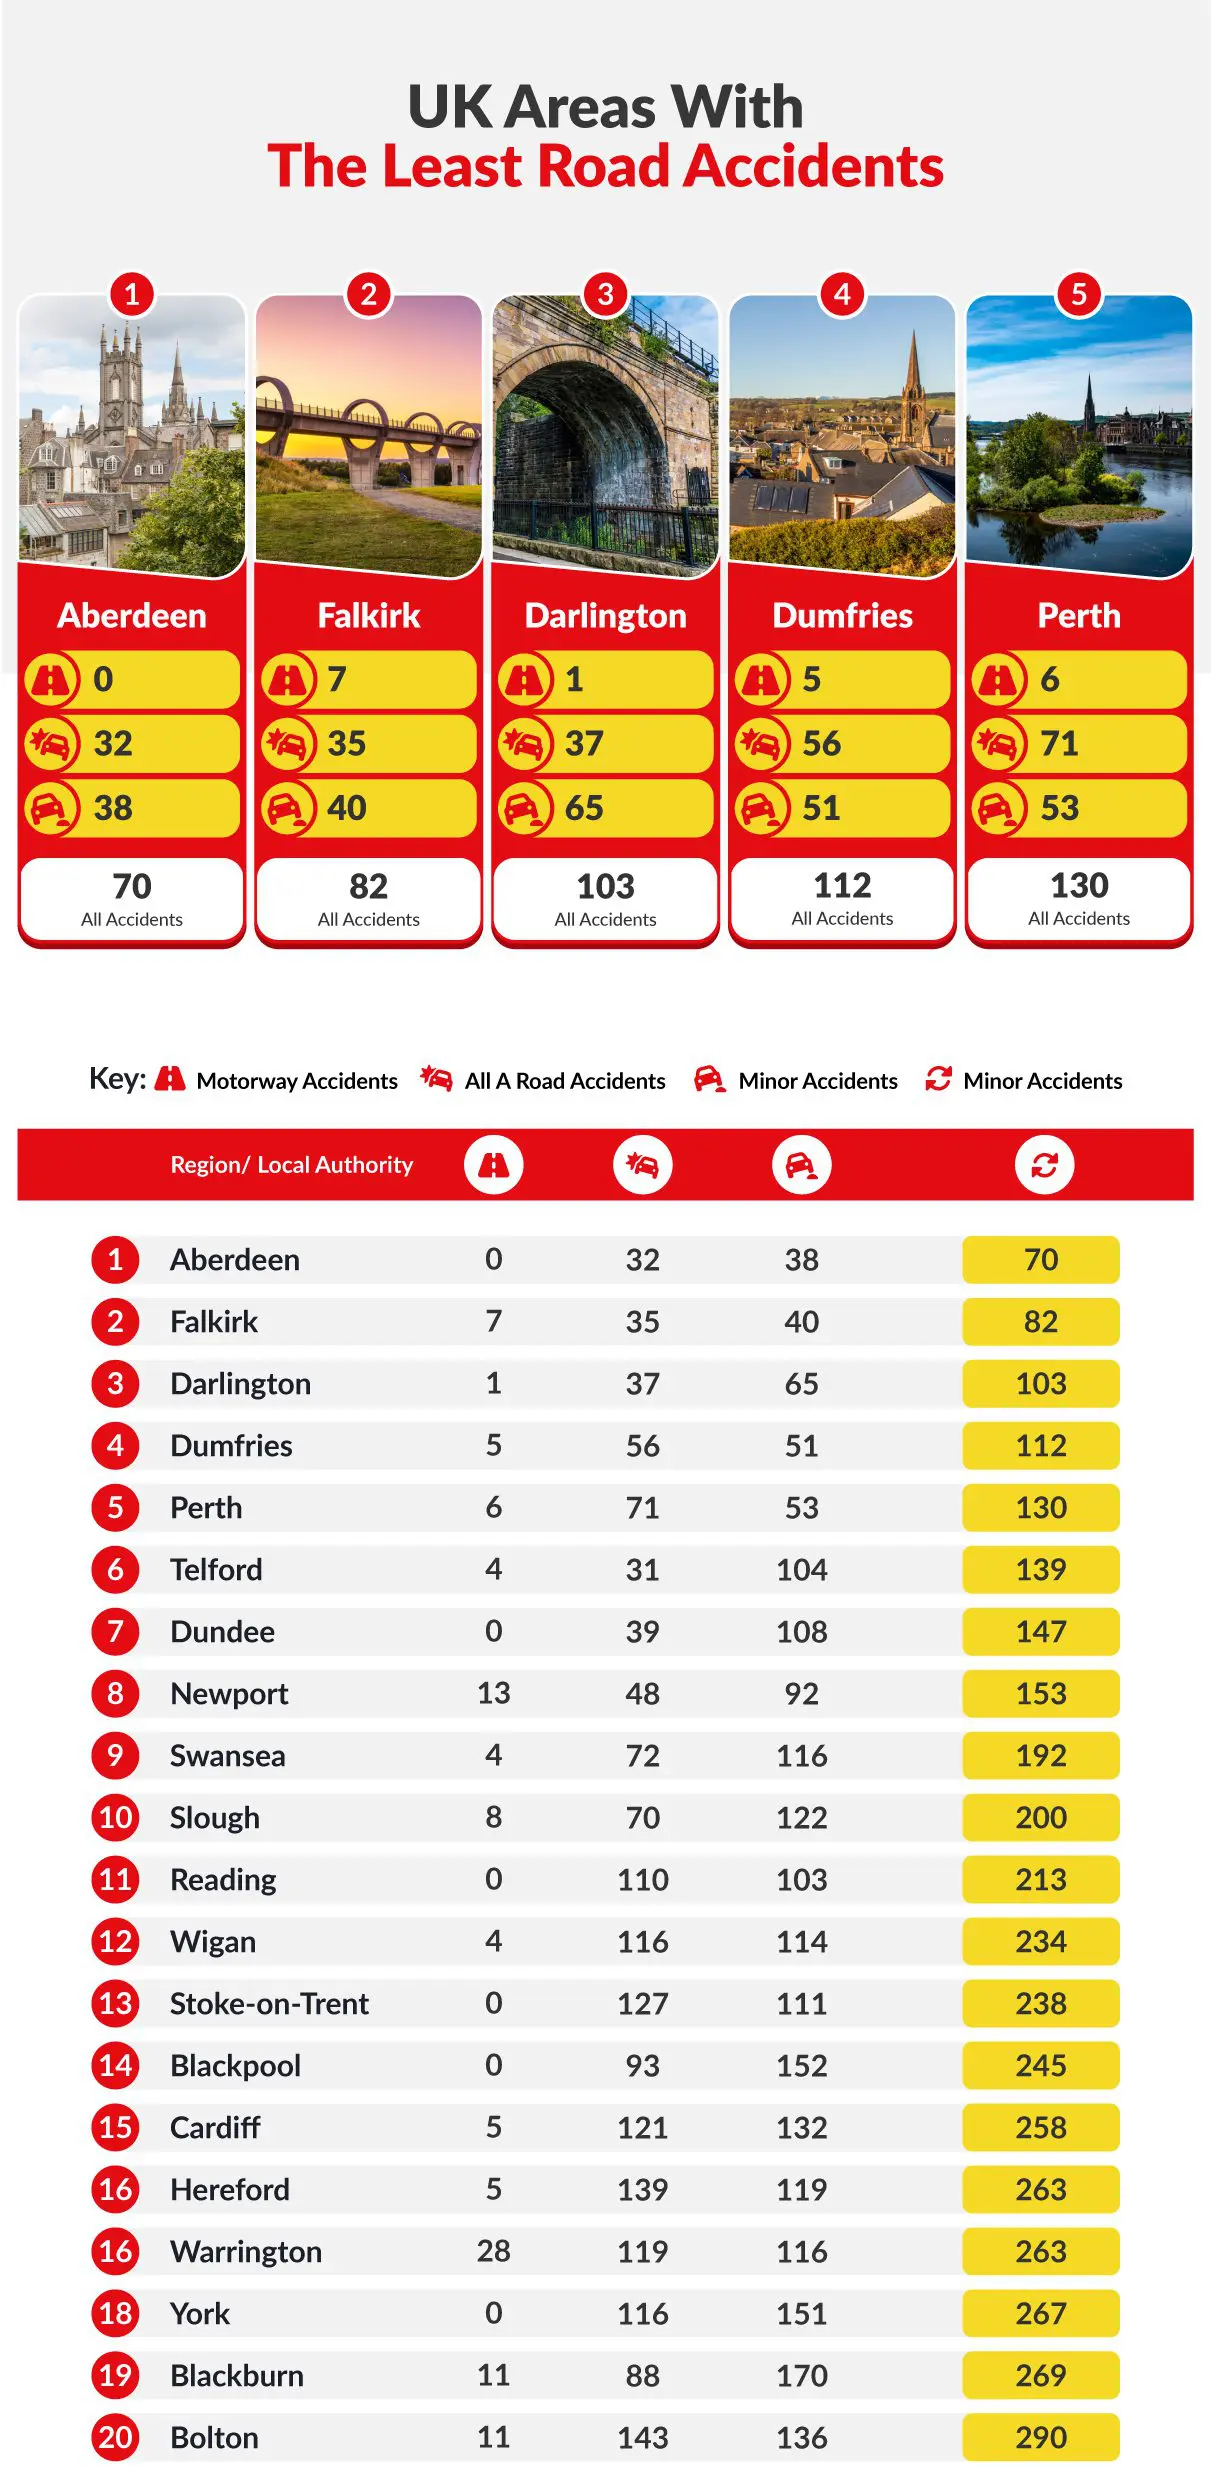
1 – Aberdeen
Motorway Accidents: 0 | All A Road Accidents: 32 | Minor Accidents: 38 | All Accidents: 70
It may come as a surprise that a major city such as Aberdeen has such a small number of road accidents, however, the latest government data reveals that the city has only had 70 accidents.
2 – Falkirk
Motorway Accidents: 7 | All A Road Accidents: 35 | Minor Accidents: 40 | All Accidents: 82
Sticking with Scotland, we have Falkirk located in the county of Stirlingshire – with just 12 more accidents than Aberdeen. The city sees a larger number of motorway accidents, but the majority here are still minor accidents as of 2020.
3 – Darlington
Motorway Accidents: 1 | All A Road Accidents: 37 | Minor Accidents: 65 | All Accidents: 103
Darlington, the large market town, is one of the only entries in the top five not based in Scotland. The majority of these accidents are classified as minor meaning there was a much lower risk to the people involved.
4 – Dumfries
Motorway Accidents: 5 | All A Road Accidents: 56 | Minor Accidents: 51 | All Accidents: 112
No surprises – yet another entry for Scotland, which is turning out to be a safe haven for driving, as Dumfries recorded just 112 road accidents over 2020, to claim fourth place. However, Dumfries is the first entry in the top five, where the majority of its accidents weren’t classified as minor, instead, they were A road incidents.
5 – Perth
Motorway Accidents: 6 | All A Road Accidents: 71 | Minor Accidents: 53 | All Accidents: 130
In fifth, we have Perth, on the banks of the River Tay. Perth recorded 130 road accidents over 2020. However, like Dumfries, the majority of the road accidents in Perth were A road accidents and they had marginally more minor accidents.

1 – Telford
Average Delay on Local “A” Roads: 19.9 seconds per vehicle per mile
Telford, located in the county of Shropshire, comes in first as the UK city with the least amount of congestion. On average in 2021, vehicles in Telford were delayed by 19.9 seconds per mile, making it the least congested town in the whole of England and the UK.
2 – Lincoln
Average Delay on Local “A” Roads: 21.3 seconds per vehicle per mile
Coming in as the second least congested city in the UK is Lincoln, in the East Midlands. With an average delay of just 21.3 seconds on local A roads, you can be sure you won’t be spending too much time in gridlocked traffic.
3 – Peterborough
Average Delay on Local “A” Roads: 22.3 seconds per vehicle per mile
Next up is the city of Peterborough, where over the course of 2021 the average delay per mile was just 22.3 seconds, which is only one second longer than Lincoln. Surely one-second longer won’t make much difference, will it?
4 – Hereford
Average Delay on Local “A” Roads: 23.8 seconds per vehicle per mile
The cathedral city of Hereford is number four, located in the county of Herefordshire in the West Midlands. This time, 1.5 seconds is the difference between Hereford and Peterborough, as Hereford recorded just 23.8 seconds delay time per mile over 2021.
5 – Cambridge
Average Delay on Local “A” Roads: 24.4 seconds per vehicle per mile
And now we have the historic city of Cambridge in fifth, with a 0.2 increase on the previous ranking sees Cambridgeshire’s average delay on local A roads come to 24.4 seconds. Impressive given how Cambridge has grown as a tourist destination and the influx of students living there.
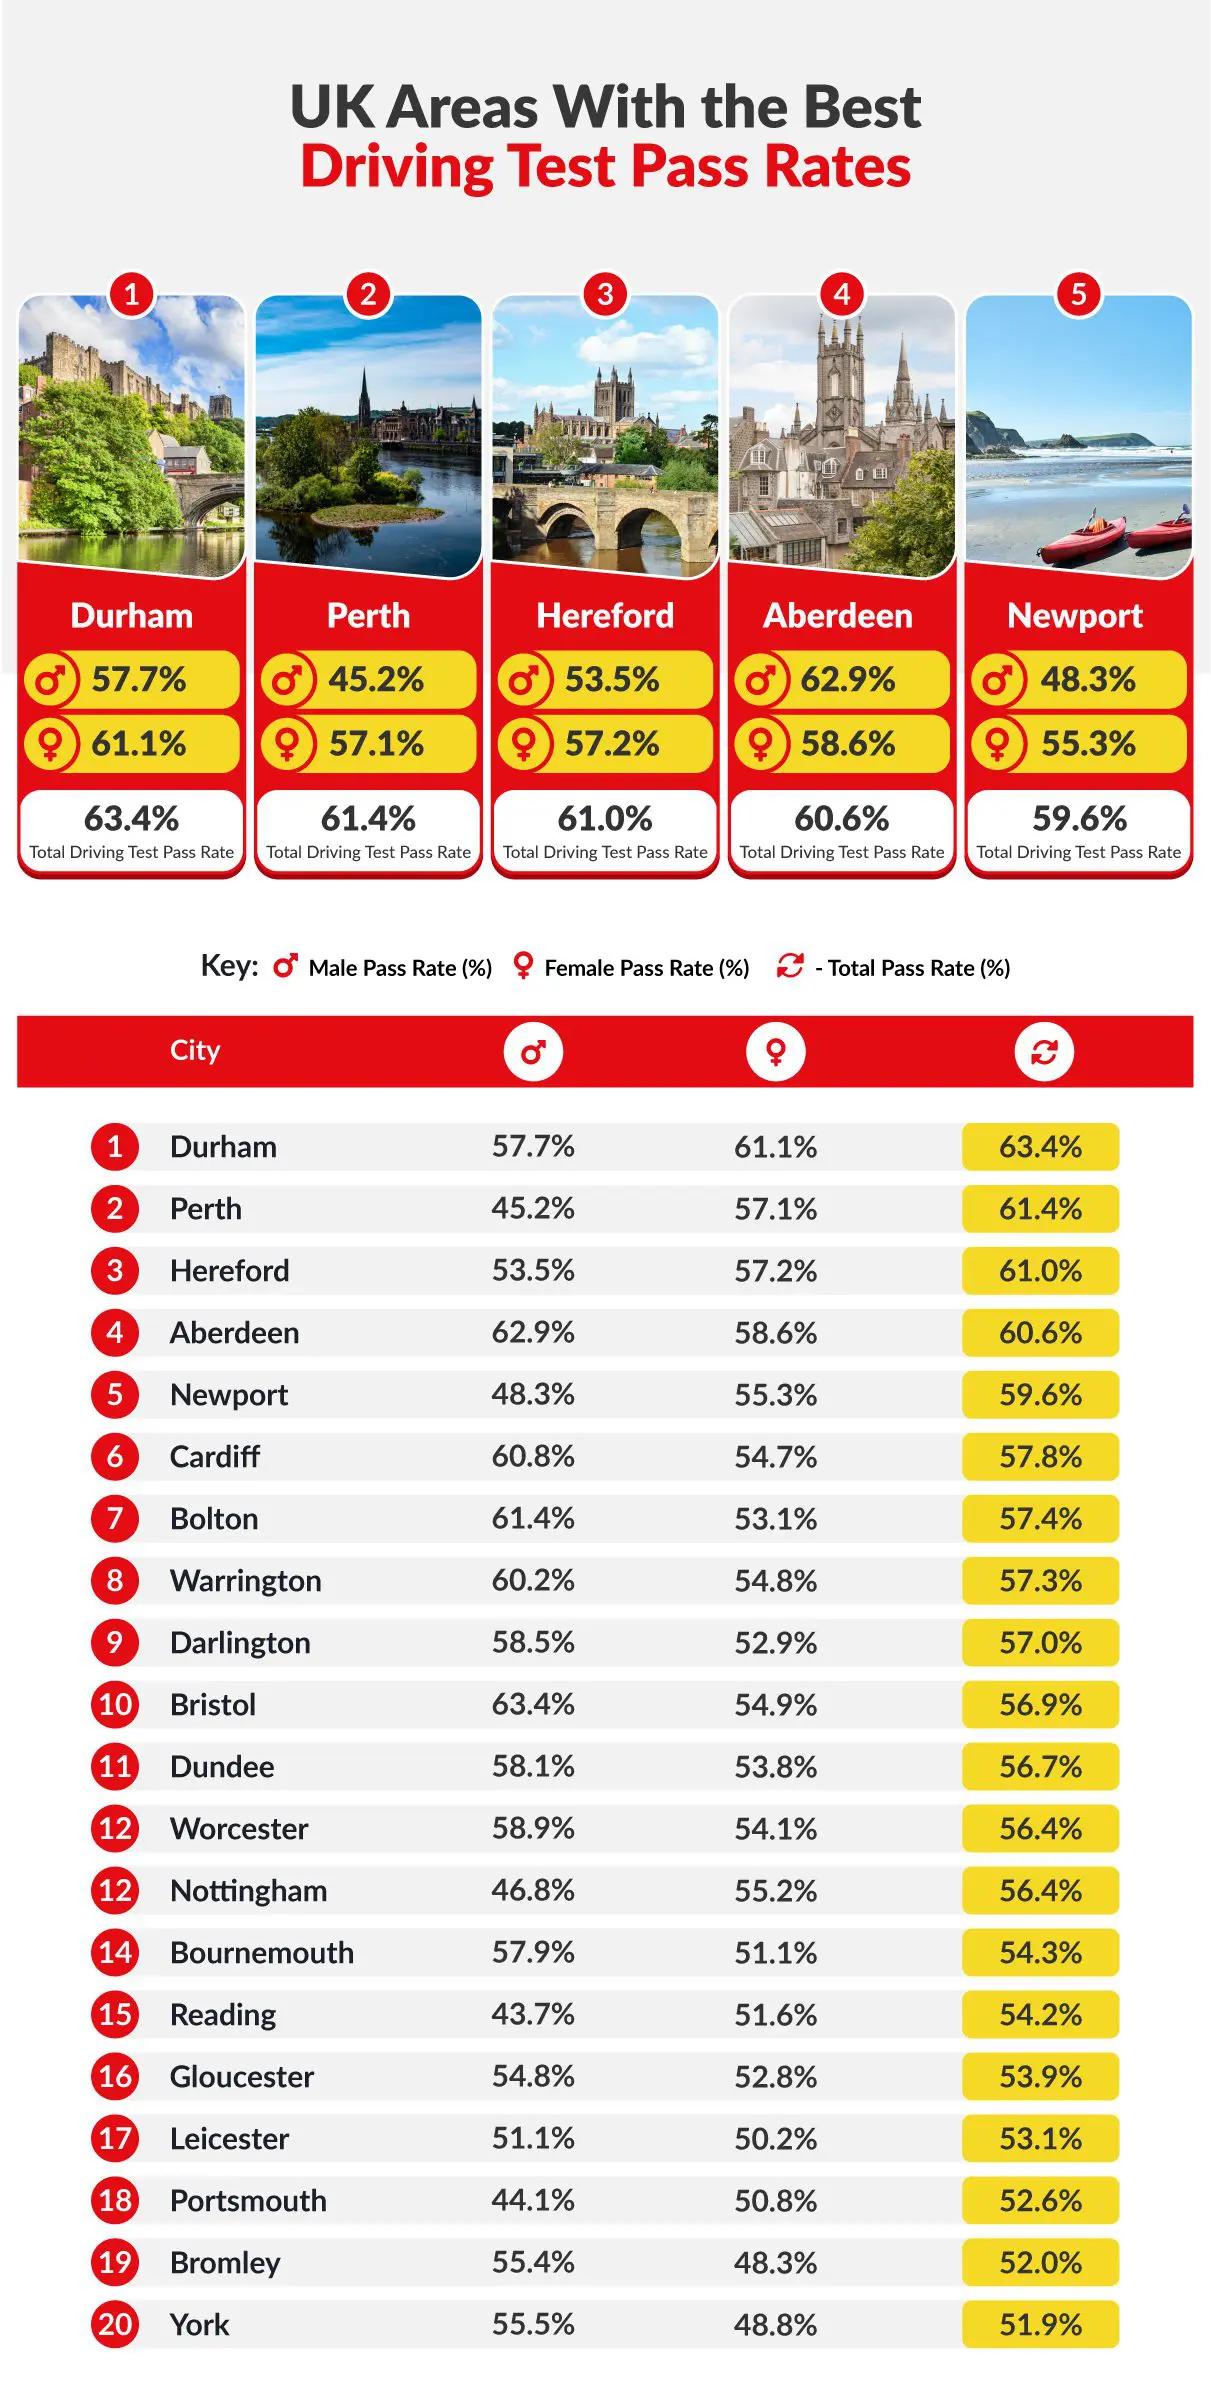
1 – Durham
Male Driving Test Pass Rate: 57.7% | Female Driving Test Pass Rate: 61.1% | Total Driving Test Pass Rate: 63.4%
Durham again, ranking high, this time for pass rates as over 2021-22 the average pass rate was 63.4%. This is good news for learner drivers in Durham looking to take their test.
2 – Perth
Male Driving Test Pass Rate: 45.2% | Female Driving Test Pass Rate: 57.1% | Total Driving Test Pass Rate: 61.4%
The Scottish city by the River Tay is back again, with an average pass rate of 61.4% over 2021-22, according to government data. This time, there is a rather large gender split, with females having a much better pass rate by more than 10% more.
3 – Hereford
Male Driving Test Pass Rate: 53.5% | Female Driving Test Pass Rate: 57.2% | Total Driving Test Pass Rate: 61.0%
The Herefordshire county town comes in third, with an average pass rate of 61% from April 2021 to March 2022. With a greater than 50% chance to pass, this again means there’s a high probability that learner drivers will pass first time in Hereford.
4 – Aberdeen
Male Driving Test Pass Rate: 62.9% | Female Driving Test Pass Rate: 58.6% | Total Driving Test Pass Rate: 60.6%
The third most populous city in Scotland just makes the top five, which is an impressive feat. Over the 2021-22 period, Aberdeen recorded an average pass rate of 60.6%, leaning slightly in favour of male drivers, as they recorded a 62.9% pass rate, compared to the 58.6% for female drivers.
5 – Newport
Male Driving Test Pass Rate: 48.3% | Female Driving Test Pass Rate: 55.3% | Total Driving Test Pass Rate: 59.6%
The Welsh city of Newport claims the final top-five spot, having recorded an average pass rate of 59.6%, dropping below 60% for the first time in this ranking. However, this still remains higher than the 49% national average, indicating a good chance for a first-time pass.
Methodology
All data for this index ranking was taken from government sources, including all areas and regions of the UK, with gender split data where applicable. In the Pass Rates data, we omitted all results where less than 1,000 driving tests were carried out to give a better representation.
Approved Instructor Data – INS0103 – December 2021
Provisional Licence Holder Data – 05 February 2022 data was taken.
Road Safety Data – RAS10014 – 2020
Congestion Data – CGN0504 (tab D) – 2021
Pass Rates Data – DVSA0201 – April 2021 – March 2022
In order to calculate the Learner Driver Score, we weighed each factor (except congestion) against one another using a scoring system to give a normalised score out of 10 for each factor. An average of these scores was then taken to give an overall score out of 10 for each location.
Congestion was omitted from the overall UK Learner Driver Score, as there was no data available for Scottish and Welsh cities, as well as London, and as such, this would interfere with the Learner Driver Score. However, we felt that as congestion is an important element for drivers, it was essential to be included in our overall table.