

Where is the pothole capital of Britain?
Potholes are a blight on tarmacked roads, characterised by depressions and cracks in the road surface, negatively impacting road users for decades. Whether you are just beginning driving lessons or are an experienced motorist, potholes can affect your journeys as they are uncomfortable, damage vehicles and can increase journey times.
It is not just drivers that potholes impact. They are even more of a menace for cyclists, horses and pedestrians as it is very easy to trip up over one, which risks falls and the injuries associated with them. Consequently, they must be promptly identified and filled in – work which is usually undertaken by local councils in England and Wales.
But where in England and Wales has the most potholes? By sending Freedom of Information requests to councils we can identify the areas with the newest potholes reported in the last year, and how many miles you can travel on average before seeing one.
Kirklees has been named the pothole capital of England and Wales, with 25.74 potholes reported per mile.
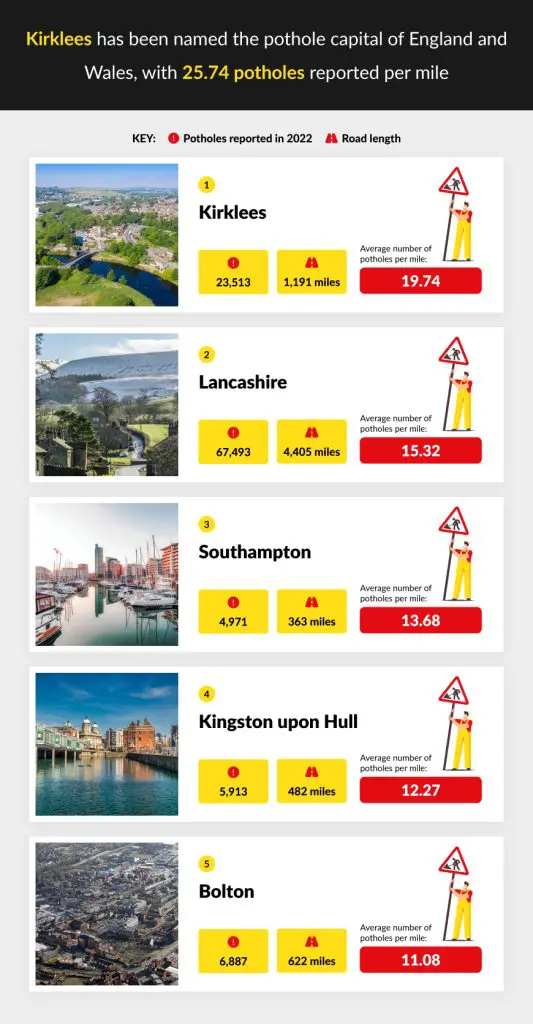
1. Kirklees
Potholes reported in 2022 – 23,513
Road length – 1,191 miles
Average number of potholes per mile – 19.74
Kirklees is a council area in West Yorkshire that includes towns such as Huddersfield, Batley and Birstall. In 2022 there were over 23,000 potholes reported to the council, meaning there are almost 20 potholes per average mile of road in the area. This makes it the pothole capital of the country, there were over 16 potholes per mile more than the national average.
2. Lancashire
Potholes reported in 2022 – 67,493
Road length – 4,405 miles
Average number of potholes per mile – 15.32
The second-highest number of potholes per mile reported in 2022 was recorded by Lancashire County Council, there were over 67,000 potholes reported in the Red Rose county. Lancashire County Council claims to have repaired all the potholes reported, meaning Lancastrians only had to worry for a short period. As there are around 4,400 miles of road in Lancashire, the average number of potholes per mile reported in 2022 is over 15.
3. Southampton
Potholes reported in 2022 – 4,971
Road length – 363 miles
Average number of potholes per mile – 13.68
On an average mile of road in Southampton there were almost 14 potholes reported to the council in 2022; there were almost 5,000 potholes in total, and the road network in Southampton covers 363 miles. Southampton City Council reported that more potholes were repaired than reported in 2022, suggesting that there are older potholes still on the city’s roads.
4. Kingston upon Hull
Potholes reported in 2022 – 5,913
Road length – 482 miles
Average number of potholes per mile – 12.27
Hull is the fourth worst area for potholes, with over 12 per average mile in the Humberside city. There were almost 6,000 potholes reported to the council in 2022, and they repaired just ver 6,000 during the same time period.
5. Bolton
Potholes reported in 2022 – 6,887
Road length – 622 miles
Average number of potholes per mile – 11.08
Completing the top five is the northwestern town of Bolton, with a population of almost 200,000 it is one of the largest towns in the country. There were just under 7,000 potholes reported in Bolton in 2022, on average this means there are over 11 potholes for each one of the 622 miles of road in the town.
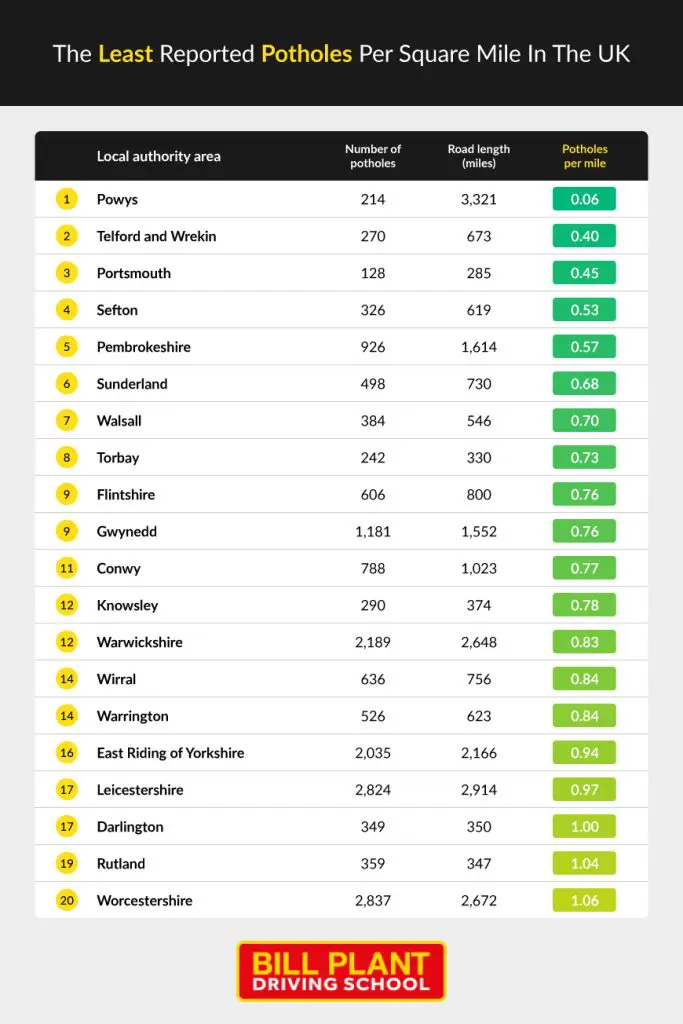
0.06 potholes were reported in Powys per square mile In 2022, which is the lowest in the UK.
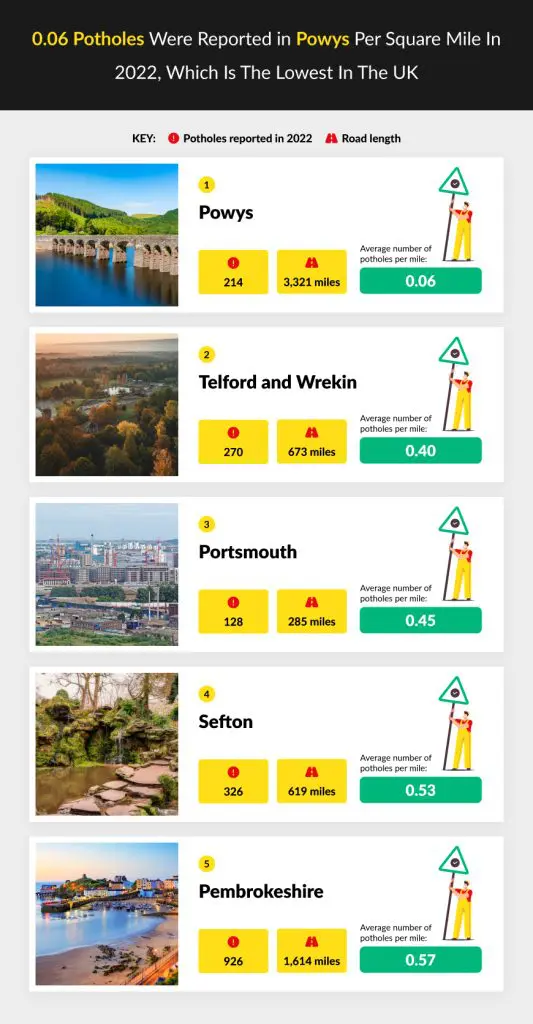
1. Powys
Potholes reported in 2022 – 214
Road length – 3,321 miles
Average number of potholes per mile – 0.06
Whilst the highly populous West Yorkshire is the pothole capital, rural Wales is the opposite, in Powys spotting potholes is like trying to find a needle in a haystack as there were only 0.06 reported per mile in 2022. The county of Powys covers a vast swathe of east Wales, roughly the same area as the independent Kingdom of the same name covered from the end of Roman rule in Britain until its division in 1160 following the death of Madog ap Meredudd.
2. Telford and Wrekin
Potholes reported in 2022 – 270
Road length – 673 miles
Average number of potholes per mile – 0.4
This local authority area in Shropshire incorporates both modern and historic parts of Britain. Telford was one of the “new towns” created by the British government in the mid-20th century, and also in the area are settlements like Ironbridge, a titan of the Industrial Revolution. There were 270 potholes reported to the council in 2022, meaning there was only 0.4 per average mile of road.
3. Portsmouth
Potholes reported in 2022 – 128
Road length – 285 miles
Average number of potholes per mile – 0.45
Portsmouth had slightly more potholes per average mile reported in 2022 than Telford and Wrekin, as there were 0.45 in the southern port city. The total length of the road network in Portsmouth is 285 miles, and there were 128 potholes reported to the council. Portsmouth council did a good job at filling its holes though, as 124 were repaired by the council in 2022.
4. Sefton
Potholes reported in 2022 – 326
Road length – 619 miles
Average number of potholes per mile – 0.53
Sefton is a borough in northern Merseyside within the city of Liverpool, it has a population of around 275,000 and is the birthplace of England international footballers Jamie Carragher and Alex Greenwood. There are 619 miles of road in Sefton and there were 326 potholes reported to the council in 2022, this means there is an average of just over 0.5 potholes per mile.
5. Pembrokeshire
Potholes reported in 2022 – 926
Road length – 1,614 miles
Average number of potholes per mile – 0.57
Another Welsh area completes the top five, as Pembrokeshire only has an average of of 0.57 potholes per mile. There were over 900 potholes reported to the council in 2022, but as there is a massive road network of 1,614 miles there were very few potholes per average mile.
Methodology
- Freedom of information requests was sent to all local authority areas in England and Wales asking for the total number of potholes reported in 2022, as well as the number repaired by the council in 2022.
- Areas that could not provide the full information were discarded, leaving us with 122 local authority areas.
- We used gov.uk road length statistics data to find the miles of road network in each local authority area and divided this by the number of reported potholes to discover the average number of miles per pothole.