

If you are a regular commuter on England’s crowded roads and highways, you’ll appreciate smooth road surfaces that are free from potholes and bumps, to ensure a safer journey for both you and your vehicle.
Highway authorities must keep the surface of public rights of way in a fit state for public use, to prevent accidents and damage to both drivers and vehicles. We wanted to explore which English local authorities are home to the country’s best roads. We will look at several factors, including; road conditions, highway and transport expenditure and roads requiring maintenance.
We also wanted to reveal how motorists should approach roads that aren’t up to scratch, and what to do if your car experiences damage caused by potholes and uneven road surfaces, which will provide helpful advice to new drivers. Whether you are taking driving lessons or are thinking about when to learn to drive, road surface safety is a point to be wary of.
The Local Authorities with the Best Road Conditions
Using road conditions in England data, which provides information about the overall state of roads in England, we found the local authorities with the highest percentage of green condition roads. The Road Condition Indicator (RCI) indicates that any stretches of road scoring below 40 are declared to be in good, or ‘green’, condition. This data refers to A-roads and motorways (not B and C and unclassified roads).
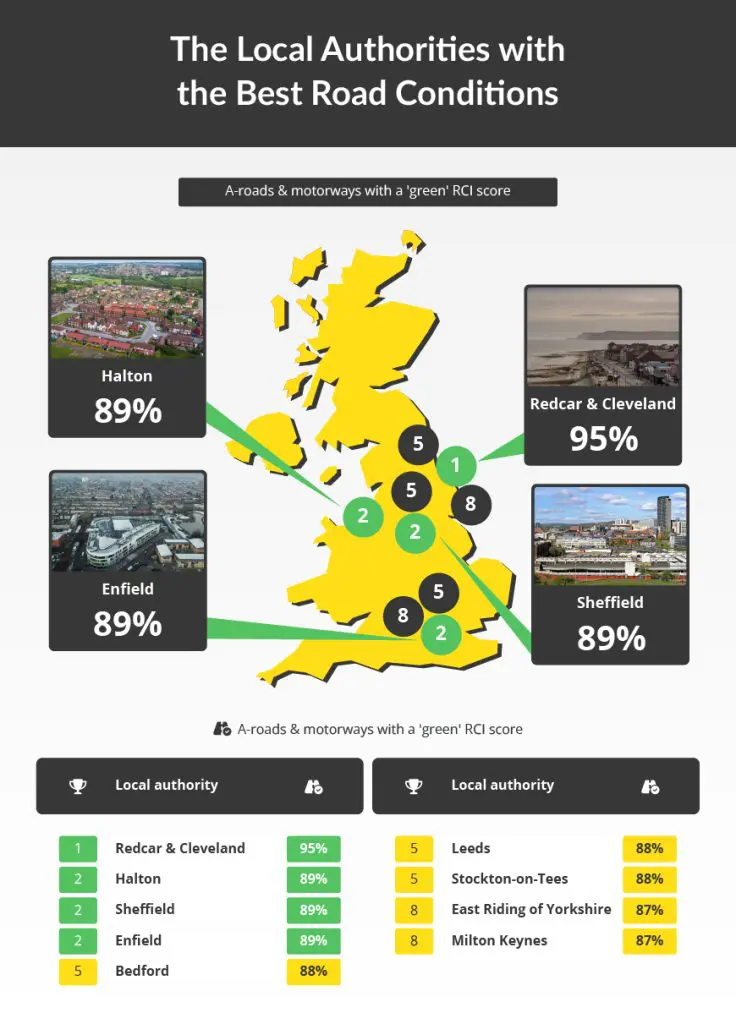
- Redcar and Cleveland
A-roads & motorways with a ‘green’ RCI score: 95%
If you’re wondering where the best roads in England are, look no further than Redcar and Cleveland, a borough with unitary authority status in North Yorkshire, England. This area has the highest number of good, or ‘green’ condition A-roads, with a total of 95% of roads getting the highest rating.
- Halton
A-roads & motorways with a ‘green’ RCI score: 89%
This unitary borough within the county of Cheshire can boast a huge proportion of good quality A-roads, with 89% being deemed to be in ‘green’ or good condition. This means that driving around the borough of Halton should be smooth with the vast majority of the motorway roads being kept in a great state.
- Sheffield
A-roads & motorways with a ‘green’ RCI score: 89%
Taking joint second place and staying in the north is Sheffield. With parts of the Peak District being within the Sheffield area, there are plenty of reasons to get out and about in your car, and with 89% of A-roads being in good condition, you can be sure that your jaunt through some of the country’s most beautiful countryside is a smooth one.
- Enfield
A-roads & motorways with a ‘green’ RCI score: 89%
Also taking the joint second spot is the London borough of Enfield. With an impressive 89% of its A-roads deemed to be in good condition. Sat on the northern outskirts of London, Enfield is a busy area, so having roads in good condition is particularly important for this location.
The Local Authorities with the Worst Road Conditions
We also looked at local authorities with the highest number of ‘red’ A-roads. The Road Condition Indicator (RCI) notes that any A-roads or motorways scoring over 100 are likely to be in poor condition and will probably need maintenance within the next year or so (called ‘red’ condition).
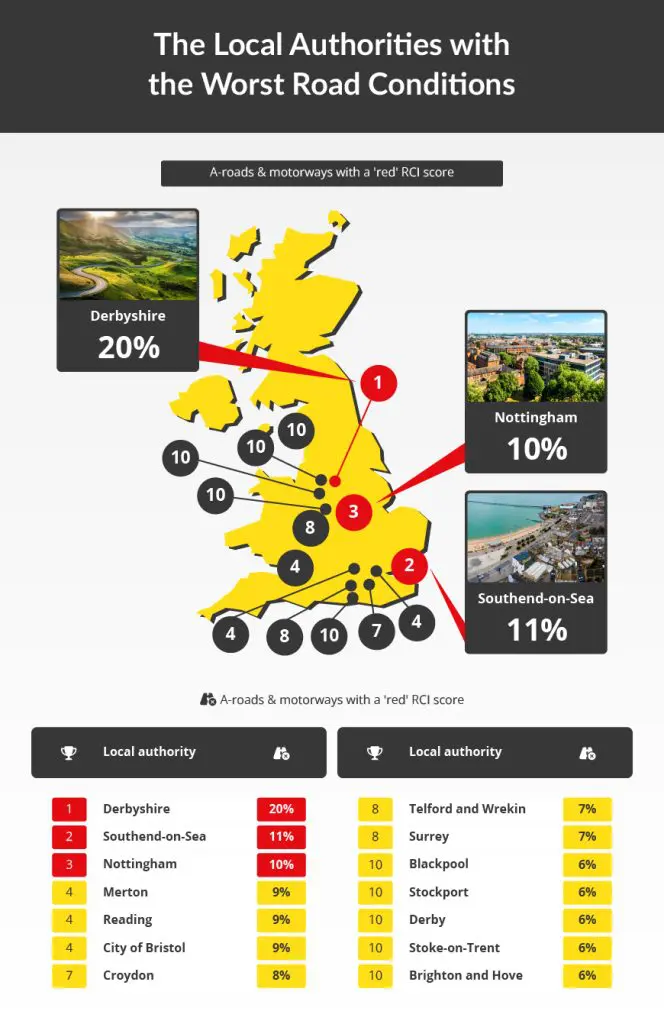
- Derbyshire
A-roads & motorways with a ‘red’ RCI score: 20%
Derbyshire has the largest percentage of A-roads and motorways in poor condition and requiring maintenance, with a total of 20% of Derbyshire roads in this state. When it comes to green roads, only 27% fall into that classification, showing that the area has motorway roads that should cause concern for drivers as poor quality roads can have an impact on car maintenance.
- Southend-on-Sea
A-roads & motorways with a ‘red’ RCI score: 11%
Southend-on-Sea, a resort town on the Thames Estuary in Essex, South East England, has the second highest percentage of A-roads in poor condition or ‘red’ roads. 11% of Southend-on-Sea roads are classified as ‘red roads’ while less than half (44%) are deemed to be green roads.
- Nottingham
A-roads & motorways with a ‘red’ RCI score: 10%
Nottingham, a city in central England’s Midlands region, has the third highest number of ‘red’ A-roads or motorway roads requiring maintenance within the next year, with 10% of Nottingham roads being given this classification.
The Areas Spending the Most on Highways and Transport
We will now look at the local authorities with the highest total expenditure spent on highways and transport services, per head of population between 2021 and 2022. Total expenditure is the sum of employee costs and running expenses.
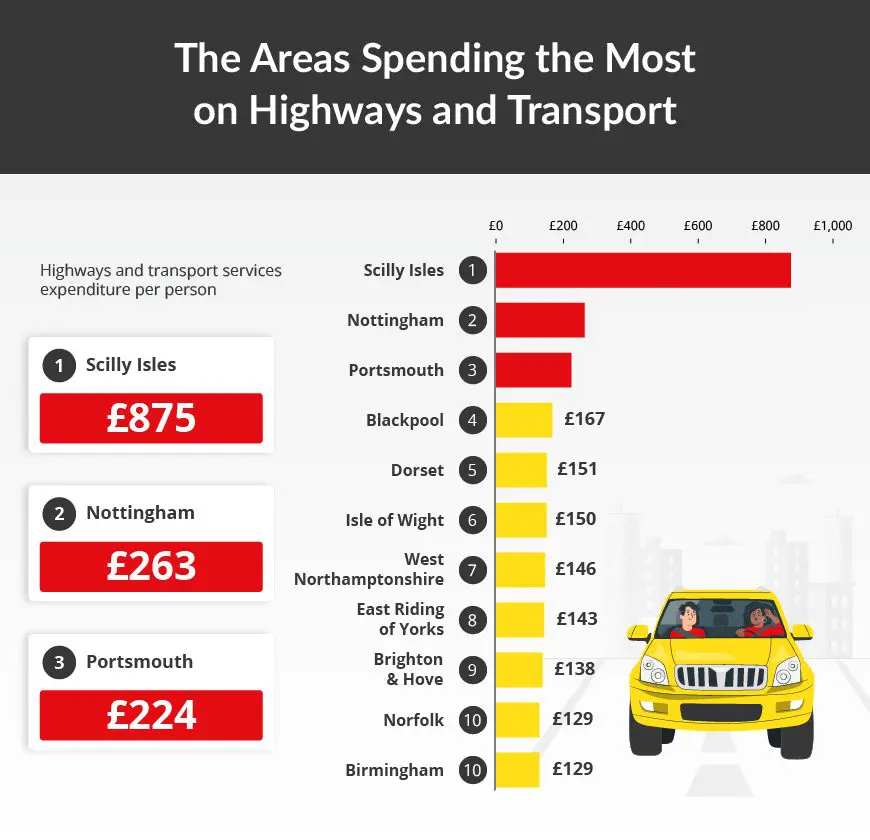
- Scilly Isles
Highways and transport services expenditure per person – £875
In first place is the Scilly Isles, an archipelago off the Cornish coast, in South West England, with a total expenditure of £875 per person. This is a particularly small area with a tiny population. In fact, with little over 2,000 residents, the money channelled into the maintenance of roads and transport services goes a long way here.
- Nottingham
Highways and transport services expenditure per person – £263
Spending £263 per head on roads and transport services, Nottingham takes second place. This level of investment is likely to be particularly beneficial for an area like Nottingham which is positioned between some large cities, including Birmingham and Sheffield. Having such large cities on the doorstep means that many residents are likely to need those transport links to commute to work, making this investment even more important.
- Portsmouth
Highways and transport services expenditure per person – £224
Taking third place is Portsmouth, a city and unitary authority on the South Coast of England. The majority of the city is located on Portsea Island, meaning that most of its roads are not on the mainland but are isolated on the island. Having this level of expenditure means that the council can invest in the roads to ensure Portsmouth residents and tourists alike can traverse the area smoothly.
London Boroughs Spending the Most on Highways and Transport
With so many London boroughs spending so much per head on highways and transport services, we decided to take a look at the city separately.
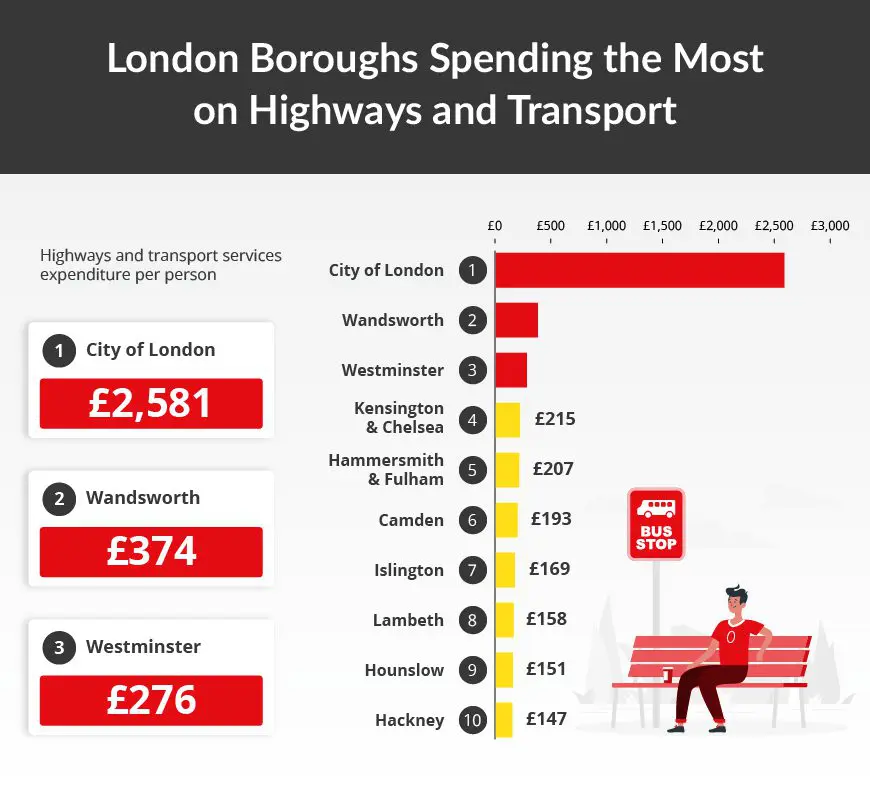
- City of London
Highways and transport services expenditure per person – £2,581
The City of London is the borough with the highest total expenditure on highways and transport services, with a total expenditure of £2,581 per person. As the City of London has such a low number of residents, this number is much higher than in other areas. Despite having such a small population, the City of London is exceptionally busy as the central business district of the capital, resulting in the need for plenty of money to be dedicated to maintaining roads and transport services.
- Wandsworth
Highways and transport services expenditure per person – £374
The borough with the second highest expenditure on highways and transport per person is Wandsworth, a London borough in southwest London, with a total expenditure of £374 per person. According to a 2017 study, Wandsworth has the lowest unemployment rate of any London borough, suggesting that transport links are essential for residents to make their way around the city for work. The high level of investment in roads and transport services is surely well-received in Wandsworth.
- Westminster
Highways and transport services expenditure per person – £276
It should come as no surprise that Westminster would rank so highly when it comes to expenditure on highways and transport services as this borough is home to government and royalty alike. With Buckingham Palace and the Palace of Westminster both within the borough, the council must maintain roads to a particularly high standard.
The Areas Requiring the Most Road Maintenance
We explored the local authorities with the most A-roads & motorways where maintenance should be considered. The results reflect the percentage of the local authority’s A-road and motorways where maintenance should be considered.
You will notice some similarities in the ranking between this table and the areas with the most ‘red’ roads. However, there are some differences as some roads marked as where maintenance should be considered may not yet classify as ‘red’ roads.
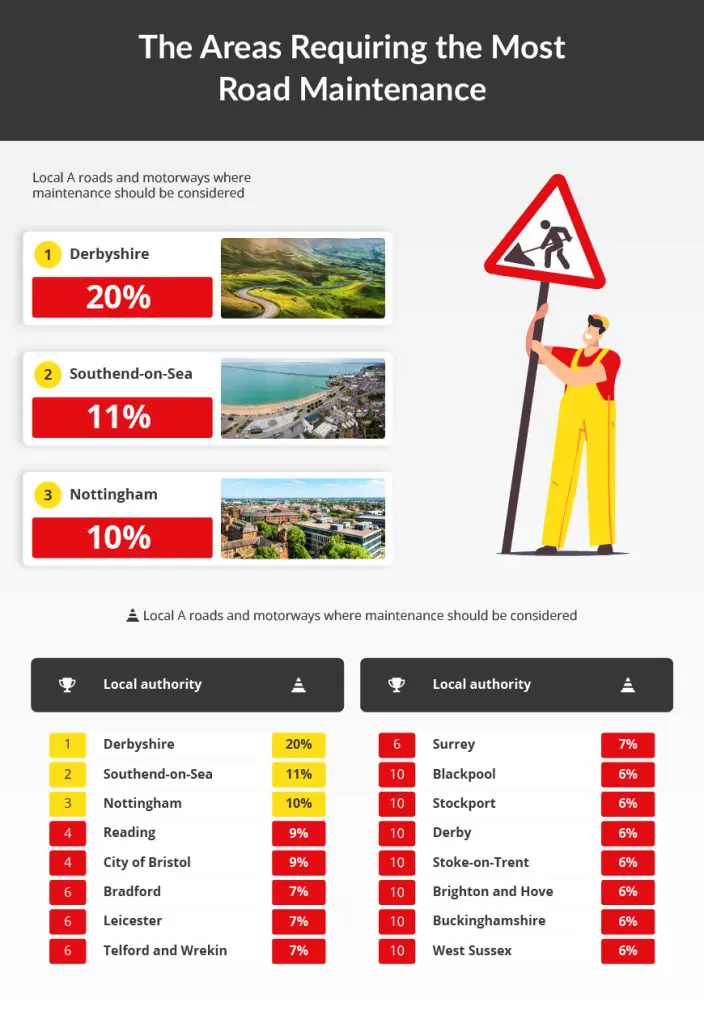
- Derbyshire
A-roads & motorways where maintenance should be considered: 20%
Derbyshire, a ceremonial county in the East Midlands, is the area with the highest number of A-roads and motorways where maintenance should be considered, with 20% of road carriageways requiring maintenance.
- Southend-on-Sea
A-roads & motorways where maintenance should be considered: 11%
Southend-on-Sea, a resort town on the Thames Estuary in Essex, southeast England, has the second highest proportion of A-roads and motorways needing work, with 11% of road carriages requiring maintenance. This coastal resort is connected directly to the capital by the A127 so is likely to see high levels of commuting every day.
- Nottingham
A-roads & motorways where maintenance should be considered: 10%
Nottingham is a city in central England’s Midlands region, taking joint third place in this ranking, with 10% of roads needing maintenance. The area has important road links to the A1 and A52, so highway maintenance seems all the more important.
The London Councils Requiring the Most Road Maintenance
Again, we were able to also look at London specifically to discover which parts of the capital have the highest proportion of A-roads and motorways in need of maintenance.
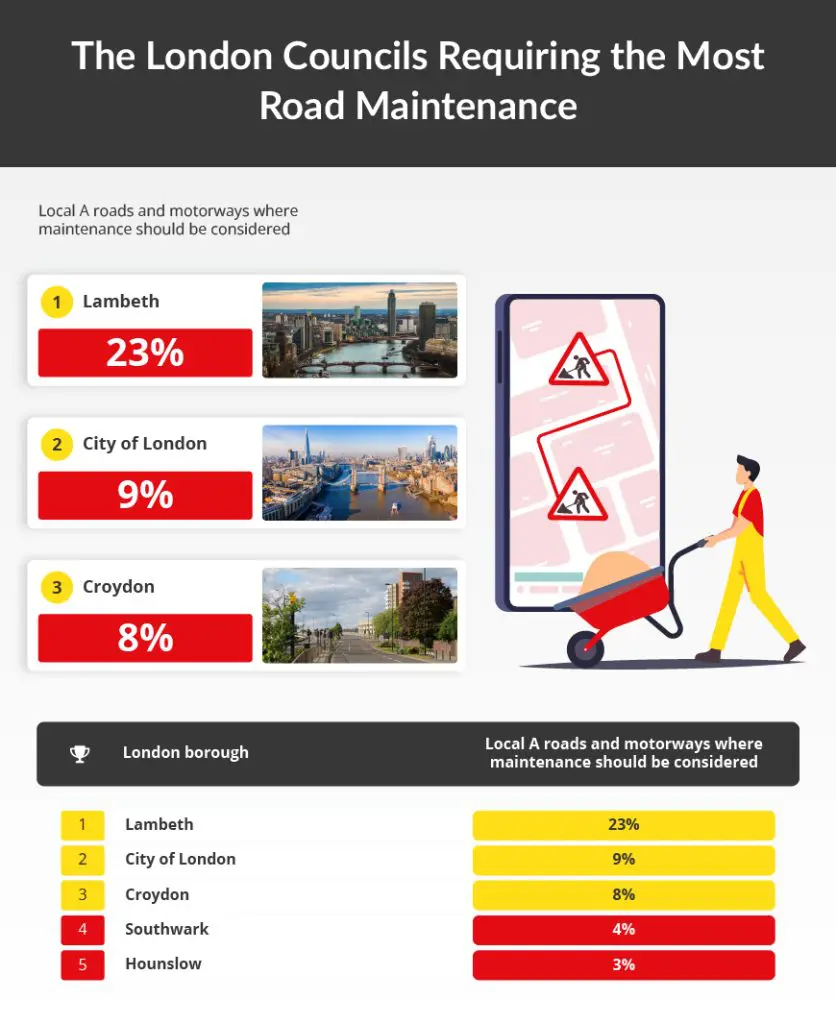
- Lambeth
A-roads & motorways where maintenance should be considered: 23%
The borough of Lambeth takes the top spot here with 23% of A-roads and motorways in the borough needing maintenance. Sitting just across the river from Westminster, Lambeth is a busy area encompassing districts such as Brixton, Clapham and Vauxhall. Like with all London boroughs, travel is of paramount importance, so having 23% of roads in need of maintenance should be of concern to the local council.
- City of London
A-roads & motorways where maintenance should be considered: 9%
Despite having the highest level of spending per head, the City of London also has one of the highest proportions of roads in need of work. The Square Mile may be tiny in comparison to other local authorities, but with 9% of roads in need of maintenance, it poses some significant questions over how that £2,580.65 per head is being spent.
- Croydon
A-roads & motorways where maintenance should be considered: 8%
Concluding the top three for London is Croydon. This borough in south London, part of Outer London, has connections across West Wickham and central areas like Brixton, among others. These connections across the area make road maintenance all the more important, but with 8% of Croydon A-roads in need of maintenance, it’s clear that the council has some work to do.
The Best Roads Compared to Highway Expenditure
When we look at the average expenditure per head across the local authorities of England (excluding London) we can see how the councils with the largest and smallest proportion of A-roads in need of maintenance compare. The average across all 117 councils is £90, so are the top performers for road quality spending more or less?
Fifteen local authorities all had just 1% of A-roads and motorways in need of maintenance. While Redcar and Darlington both spent considerably more than the average per-head expenditure of £90, the remaining councils came in below average, with Sunderland spending just £54 per head.
Despite this low level of expenditure, these areas are still managing to maintain their roads and transport services, perhaps suggesting that they are more proactive in their approach, tackling issues before they become more severe and more costly.
The Worst Roads Compared to Highway Expenditure
At the other end of the spectrum, how do the areas with the highest proportion of A-roads and motorways in need of maintenance compare in terms of their expenditure?
As previously stated, the average expenditure per head across the 117 councils is £90, and while the areas with the best roads were largely able to keep their expenditure down, the majority of these areas with roads in poor condition are spending more.
Out of the top areas with the largest proportion of roads in need of maintenance, just four have lower than average expenditure, with Derbyshire, Bradford, Telford and Wrekin and Surrey spending less than £90 per head.
However, the remaining six are spending more, with Nottingham spending far more than average with £263 being spent per head. Despite the large sums being spent on highways and transport services, 10% of Nottingham’s A-roads and motorways require maintenance.
London’s Roads Compared to Highway Expenditure
While we’ve seen how the rest of England performs, how do London’s boroughs with the worst motorways do in terms of the level of expenditure compared to their road quality?
It is difficult to provide a reliable average with such a drastic outlier sitting near the top of the table, spending more than £2.5K per head in the City of London.
However, when compared to the rest of England, we can see that expenditure does seem to be higher, with more than half of London councils spending over £100 per head on highways and transport services.
It does seem as though this level of spending is paying off, however, with London councils seeming to have fewer A-roads and motorways in need of maintenance, with Lambeth sitting at the top with 23% of roads in need of work.
How Should Motorists Drive on Uneven Road Surfaces?
Even the most experienced drivers could face having to pay extortionate prices for vehicle damage and repairs due to uneven and unsafe road conditions. Drivers who have just passed their test may not be accustomed to driving on unfamiliar roads, and so could in turn damage their vehicle if they do not take a steady approach.
While there is little that drivers can do about road quality, you can learn to drive more perceptively. To learn how to drive on rough, uneven roads, here are some helpful tips:
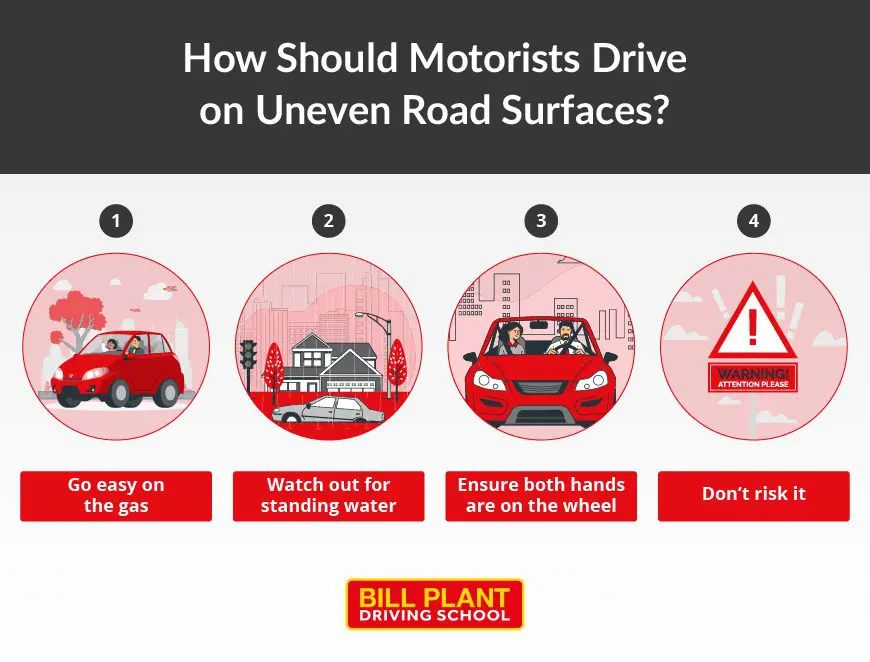
Go Easy on the Gas
The first step is simple: drive slowly. You should drive at a slower pace than you’re normally used to. As you get used to driving close to the speed limit, facing an uneven road demands that you keep to a speed that feels comfortable to ensure the safety of your car. It also allows you to watch your surroundings and avoid potential hazards.
Watch Out for Standing Water
There are several causes of tire damage, but impacts from driving on potholes are common when driving on poor road quality. Potholes are impossible to avoid, but standing water is truly dangerous. Standing water is tricky as it’s sometimes difficult to measure its depth. You should avoid pools of standing water at all costs.
Ensure Both Hands are on the Wheel
You should intentionally grip your steering wheel on bad roads with both hands. If you drive over an unsuspecting bump, you could lose control of the car as you scramble to regain it. Ensuring both hands are on the wheel helps to anticipate surprises and maintain control.
Don’t Risk it
Our final piece of advice for driving on uneven roads is to turn around if necessary. Rather than driving on, you must know your vehicle’s limits. While finding another route will cost you some time, it’s better than getting involved in an accident, or a car problem which could mean forking out cash for a costly repair.
Methodology
Local Authorities with the Best Road Conditions
Gov.UK’s data table was taken for the 2022 year Road Condition Indicator scores for surveyed local authority classified principal roads, by LA in England to find the local authorities with the best and worst road conditions based on a road indicator score. Only the authorities with data available were used.
The Local Authorities that Spent the Most on Highways and Transport
We took data from the Department for Levelling Up, Housing and Communities and the Ministry of Housing, Communities & Local Government’s local authority revenue expenditure and financing, calculated per head of population. This includes employee costs and running expenses.
The Areas Requiring the Most Road Maintenance
We used data from the Department for Transport’s road condition statistics: data tables (RDC) to find the percentage of the local authority’s A-roads and motorways where maintenance should be considered. This data is accurate as of 31/01/22.